EstiMate
Topics:
Miscellaneous
EstiMate is a tool that aides CMU Product Management Essentials students in calculating their product financials. Students can dynamically select specifications of their novel product idea and see product estimates, such as the development duration and costs, update in real-time. EstiMate transforms the previous static spreadsheet into an easy-to-use web interface.
Roles:
Sole researcher, designer, developer
Duration:
May 2025 - Sep 2025
Tools:
Figma
TypeScript
HTML
CSS

EstiMate
Topics:
Miscellaneous
EstiMate is a tool that aides CMU Product Management Essentials students in calculating their product financials. Students can dynamically select specifications of their novel product idea and see product estimates, such as the development duration and costs, update in real-time. EstiMate transforms the previous static spreadsheet into an easy-to-use web interface.
Roles:
Sole researcher, designer, developer
Duration:
May 2025 - Sep 2025
Tools:
Figma
TypeScript
HTML
CSS
Background
Background
Students learn core product management concepts and need support in applying them to the product financials calculations of their own product ideas.
Students learn core product management concepts and need support in applying them to the product financials calculations of their own product ideas.
Previous Solution - The Spreadsheet
Previous Solution - The Spreadsheet
In Spring 2025, students used a spreadsheet for this support. This spreadsheet was split across 6 tabs, Tool Introduction and Steps 1-5. The tabs for steps 1-3 allowed students to select options representing aspects of their product idea, including deployment types (e.g., mobile, IoT), components (e.g., Gen AI, VR/AR), and non-functional requirements (e.g., security level, response time). Students could view the product estimates, such as development time and cost, in Step 4 and a detailed staffing plan in Step 5. Behind the scenes, a complex set of calculations was taking place to translate selections in Steps 1-3 to the product estimates seen in Step 4. I learned more about the underlying calculations via conversation with the VP of Engineering who co-built the spreadsheet with the class professor.
In Spring 2025, students used a spreadsheet for this support. This spreadsheet was split across 6 tabs, Tool Introduction and Steps 1-5. The tabs for steps 1-3 allowed students to select options representing aspects of their product idea, including deployment types (e.g., mobile, IoT), components (e.g., Gen AI, VR/AR), and non-functional requirements (e.g., security level, response time). Students could view the product estimates, such as development time and cost, in Step 4 and a detailed staffing plan in Step 5. Behind the scenes, a complex set of calculations was taking place to translate selections in Steps 1-3 to the product estimates seen in Step 4. I learned more about the underlying calculations via conversation with the VP of Engineering who co-built the spreadsheet with the class professor.


Understanding the Problem Space
Understanding the Problem Space
To understand the shortcomings of the existing spreadsheet, I interviewed 6 students from the Spring 2025 cohort shortly after the semester ended. The interviews led to the following insights in regard to the existing tool:
Selections were spread across multiple tabs, each containing lots of information and examples that felt overwhelming
The outcomes for cost and duration lived in their own tab, making it difficult to connect inputs with results
Students alternated between slides, notes, and spreadsheet to review concepts that were referenced and ensure alignment
To understand the shortcomings of the existing spreadsheet, I interviewed 6 students from the Spring 2025 cohort shortly after the semester ended. The interviews led to the following insights in regard to the existing tool:
Selections were spread across multiple tabs, each containing lots of information and examples that felt overwhelming
The outcomes for cost and duration lived in their own tab, making it difficult to connect inputs with results
Students alternated between slides, notes, and spreadsheet to review concepts that were referenced and ensure alignment
The spreadsheet was difficult to use, lacked transparency on outcome generation, and required significant context-switching to use.
The spreadsheet was difficult to use, lacked transparency on outcome generation, and required significant context-switching to use.
Understanding the Problem Space Continued
Understanding the Problem Space Continued

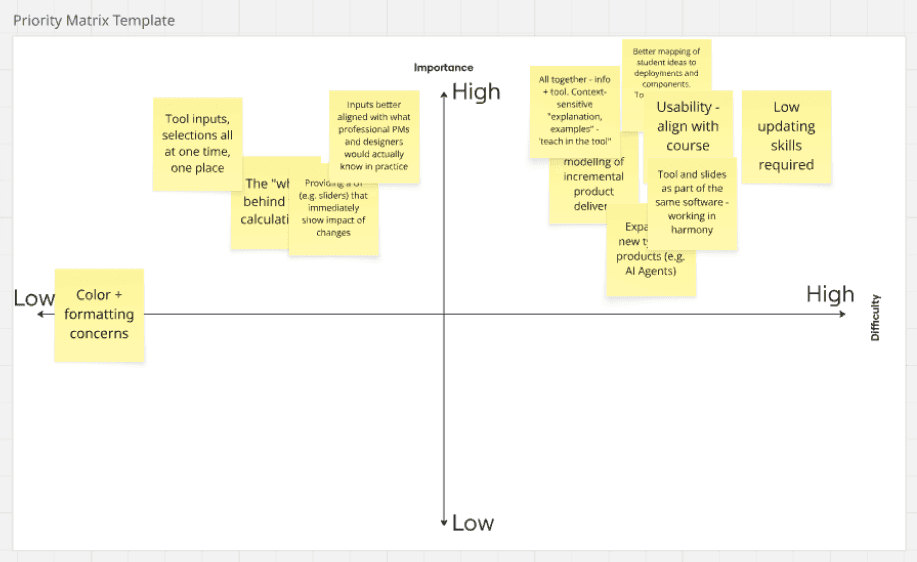
In addition to synthesizing insights, I used affinity clustering on the qualitative interview data to derive design principles for a potential solution:
Students can make all relevant selections and view outcomes without switching pages
Product estimates update in real time to reflect the implications of each selection
Embedded instructional text provides sufficient detail to support recall of key concepts
Deeper support is available through links to relevant course materials, such as lecture slides
I then sought to understand the course instructor’s goals, listed below:
Reduce the amount of class time spent explaining how to use the tool
Support students’ understanding of product financials, created in the last assignment
Proactively address common student questions
Easy to maintain / update to align with future class iterations
Given the significant changes needed to the UX/UI of the product estimation tool, we decided to build a new web interface. In parallel, we also decided to create a new information architecture for how to define a product.
In addition to synthesizing insights, I used affinity clustering on the qualitative interview data to derive design principles for a potential solution:
Students can make all relevant selections and view outcomes without switching pages
Product estimates update in real time to reflect the implications of each selection
Embedded instructional text provides sufficient detail to support recall of key concepts
Deeper support is available through links to relevant course materials, such as lecture slides
I then sought to understand the course instructor’s goals, listed below:
Reduce the amount of class time spent explaining how to use the tool
Support students’ understanding of product financials, created in the last assignment
Proactively address common student questions
Easy to maintain / update to align with future class iterations
Given the significant changes needed to the UX/UI of the product estimation tool, we decided to build a new web interface. In parallel, we also decided to create a new information architecture for how to define a product.
Designing and Building Initial Prototypes
Designing and Building Initial Prototypes

With a clear understanding of the users' needs, I began ideating what features of the tool would look like. To truly represent the interconnected nature of elements and embody the key principle of transparency, creating designs on paper or Figma would not be sufficient. Rather, I needed to quickly build and iterate through coded prototypes. To streamline this process so that I could focus on key interactions rather than learning new syntax, I leveraged AI coding agents to help build these prototypes. After exploring a variety of such tools, I ended up using Bolt and Gemini the most.
In order to effectively prototype the user experience, I had to make assumptions that significantly simplified the underlying calculation model. In this original model, each selection that a user made had an associated multipliers that would change the product estimation results.
Building the new UX required prototyping with AI and making temporary assumptions.

Iterating on the Information Architecture
Iterating on the Information Architecture
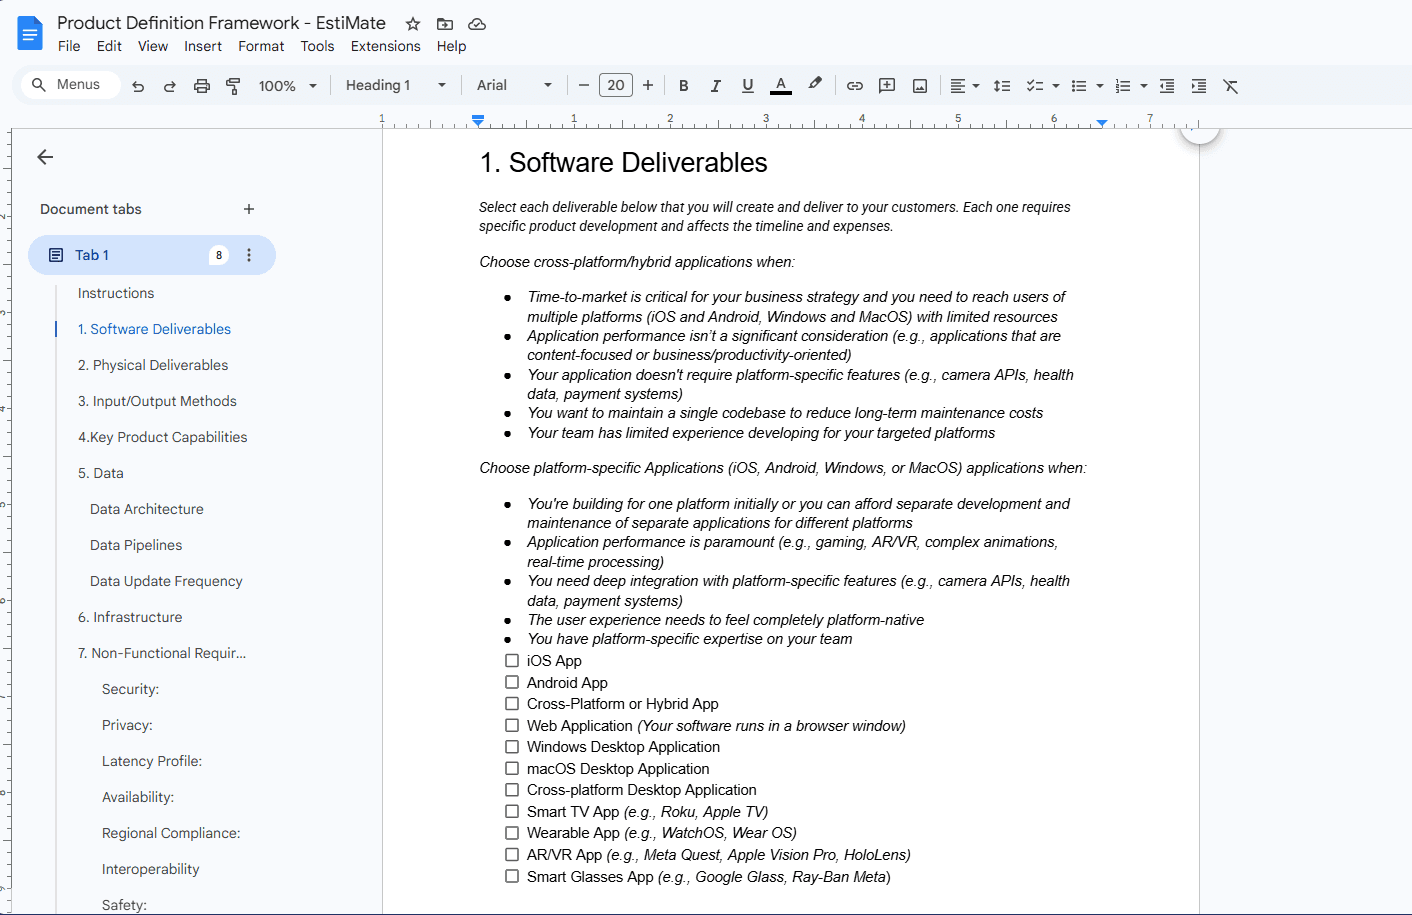
When building the prototypes, I also made the content of the information architecture as modular as possible. This was because the professor, VP of Engineering, and I were trying to align on what elements define a product in parallel to the UX prototypes. This alignment process took multiple weeks and required considering factors like understandability of terms and the complexity of interrelations between terms. I represented the voice of the students, offering input grounded in the interviews and my own experience, and helped reach a decision in cases of disagreement.
When building the prototypes, I also made the content of the information architecture as modular as possible. This was because the professor, VP of Engineering, and I were trying to align on what elements define a product in parallel to the UX prototypes. This alignment process took multiple weeks and required considering factors like understandability of terms and the complexity of interrelations between terms. I represented the voice of the students, offering input grounded in the interviews and my own experience, and helped reach a decision in cases of disagreement.
Prototypes were built to easily adapt to our iterations on the product definition framework.
Prototypes were built to adapt to iterations of the information architecture.
Designing and Building Initial Prototypes

With a clear understanding of our target audience and their needs, we began brainstorming potential solutions. We were encouraged by the teaching staff to take risks and push the boundaries of social comfort. To spark creativity, we applied the Crazy 8s method, after which each team member created three storyboards addressing a unique need. Additionally, we developed cover pages for each storyboard, outlining the addressed user need and including discussion questions to gain further insights during user testing.
In order to effectively prototype the user experience, I had to make assumptions that significantly simplified the underlying calculation model. In this original model, each selection that a user made had an associated multipliers that would change the product estimation results.
Building the new UX required prototyping with AI and making temporary assumptions.
The Solution
The Solution
Once the information architecture was finalized and integrated into the tool's UI, I then had to replace the previous model of time and cost multipliers to calculate results with the actual interrelated complexities to get the results. I did this process step-by-step, outlining all the functions in a spreadsheet first to help guide and ensure that the underlying model is correct. As I made incremental changes to the calculations, I also worked with the VP of Engineering to test each piece and make sure that all functions give the correct outputs.

Once the calculations were all complete, I interviewed multiple TAs of the Fall 2025 semester to get their perspectives on the tool and finalize the user experience. There was minimal feedback during this stage, as TAs all reported that this interface would significantly improve understanding and time taken for assignments involving product estimates.
Evaluating Impact
Evaluating Impact
Having already gathered qualitative feedback from TAs that suggested the tool would be an improvement over the spreadsheet, I also devised a plan to evaluate the impact with students in the Fall 2025 semester (who did not have previous experience with the spreadsheet).
The plan was created to measure metrics relating to the overarching goals:
Reduce instructional overhead: Decrease the amount of time instructors and TAs spend explaining the tool's functionality
Increase efficiency: Reduce average assignment completion time for those involving the tool
Improve curriculum integration: Enhance transparency and connection between tool content and course materials
Enhance learning outcomes: Improve students' overall understanding of product financials
The plan is split across 3 phases: a survey directly after the first assignment using the tool, the same survey after the final assignment, and interviews with students at the end of the class. I designed the survey and interview questions to offer both quantitative and qualitative insight for the goals.
Having already gathered qualitative feedback from TAs that suggested the tool would be an improvement over the spreadsheet, I also devised a plan to evaluate the impact with students in the Fall 2025 semester (who did not have previous experience with the spreadsheet).
The plan was created to measure metrics relating to the overarching goals:
Reduce instructional overhead: Decrease the amount of time instructors and TAs spend explaining the tool's functionality
Increase efficiency: Reduce average assignment completion time for those involving the tool
Improve curriculum integration: Enhance transparency and connection between tool content and course materials
Enhance learning outcomes: Improve students' overall understanding of product financials
The plan is split across 3 phases: a survey directly after the first assignment using the tool, the same survey after the final assignment, and interviews with students at the end of the class. I designed the survey and interview questions to offer both quantitative and qualitative insight for the goals.
To truly understand whether EstiMate is effective, I created an evaluation plan involving administering surveys and interviewing students of the Fall 2025 semester.
To truly understand whether EstiMate is effective, I created an evaluation plan involving administering surveys and interviewing students of the Fall 2025 semester.
The Solution
After analyzing the speed dating results, we determined that a game highlighting the inner workings of AI would be the most effective solution. A discussion with our TA further refined this idea, leading us to focus on the concept of guardrails—content filters designed to mitigate biased results. We created a low-fidelity paper prototype of the game to simulate the mechanics and conducted usability testing with three participants to assess its effectiveness.

Once the calculations were all complete, I interviewed multiple TAs of the Fall 2025 semester to get their perspectives on the tool and finalize the user experience. There was minimal feedback during this stage, as TAs all reported that this interface would significantly improve understanding and time taken for assignments involving product estimates.
My Learnings
My Learnings
1.
Embracing product manager and researcher mindsets
Embracing product manager and researcher mindsets
Before this project, I had a foundational understanding of UX research through previous coursework and other projects. This project challenged me to explore a variety of methods and critically evaluate how each could contribute to our goals and deepen our insights within the problem space.
2.
2.
Balancing mixed stakeholder opinions
Balancing mixed stakeholder opinions
This project introduced me to the rose-bud-thorn method as an approach to conflict management. I also developed my communication and mediation skills, facilitating open discussions to navigate tensions and maintain focus on our objectives.
Next Steps
Evaluating effectiveness in class
20+ students have already used EstiMate in the Fall 2025 semester. These students were asked about their experiences via surveys after related assignments and at the end of the class. These have revealed improvements in understanding and completion time. Continued evaluation in Spring 2026 will help ensure that EstiMate remains effective in supporting students.
2.
Refinement of tool based on feedback
Students have already reported features that EstiMate could include to better support them, such as autosave and summarizing inputs selected at the bottom of a section. Parallel to the evaluation, continued iteration on the tool will ensure student understanding and alignment with class materials.
My Learnings
Effectively applying many UX research methods
Before this project, I had a foundational understanding of UX research through previous coursework and other projects. This project challenged me to explore a variety of methods and critically evaluate how each could contribute to our goals and deepen our insights within the problem space.
2.
Managing conflict
This project introduced me to the rose-bud-thorn method as an approach to conflict management. I also developed my communication and mediation skills, facilitating open discussions to navigate tensions and maintain focus on our objectives.
Next Steps
1.
Evaluating effectiveness in class
20+ students have already used EstiMate in the Fall 2025 semester. These students were asked about their experiences via surveys after related assignments and at the end of the class. These have revealed improvements in understanding and completion time. Continued evaluation in Spring 2026 will help ensure that EstiMate remains effective in supporting students.
2.
Refinement of tool based on feedback
Students have already reported features that EstiMate could include to better support them, such as autosave and summarizing inputs selected at the bottom of a section. Parallel to the evaluation, continued iteration on the tool will ensure student understanding and alignment with class materials.